Gauges and Scores
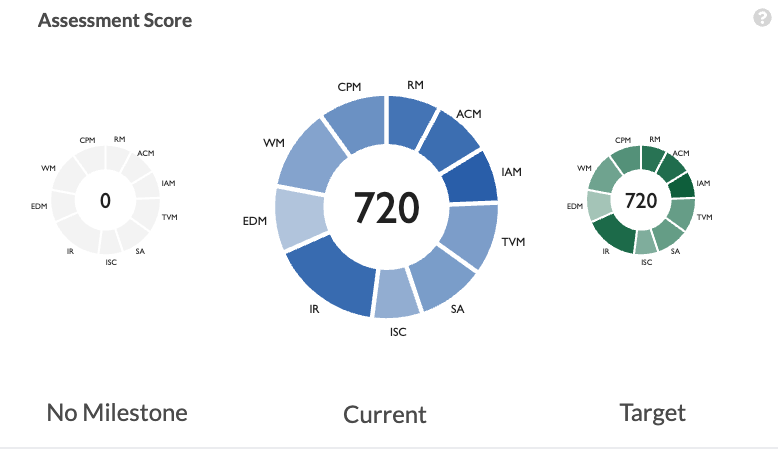
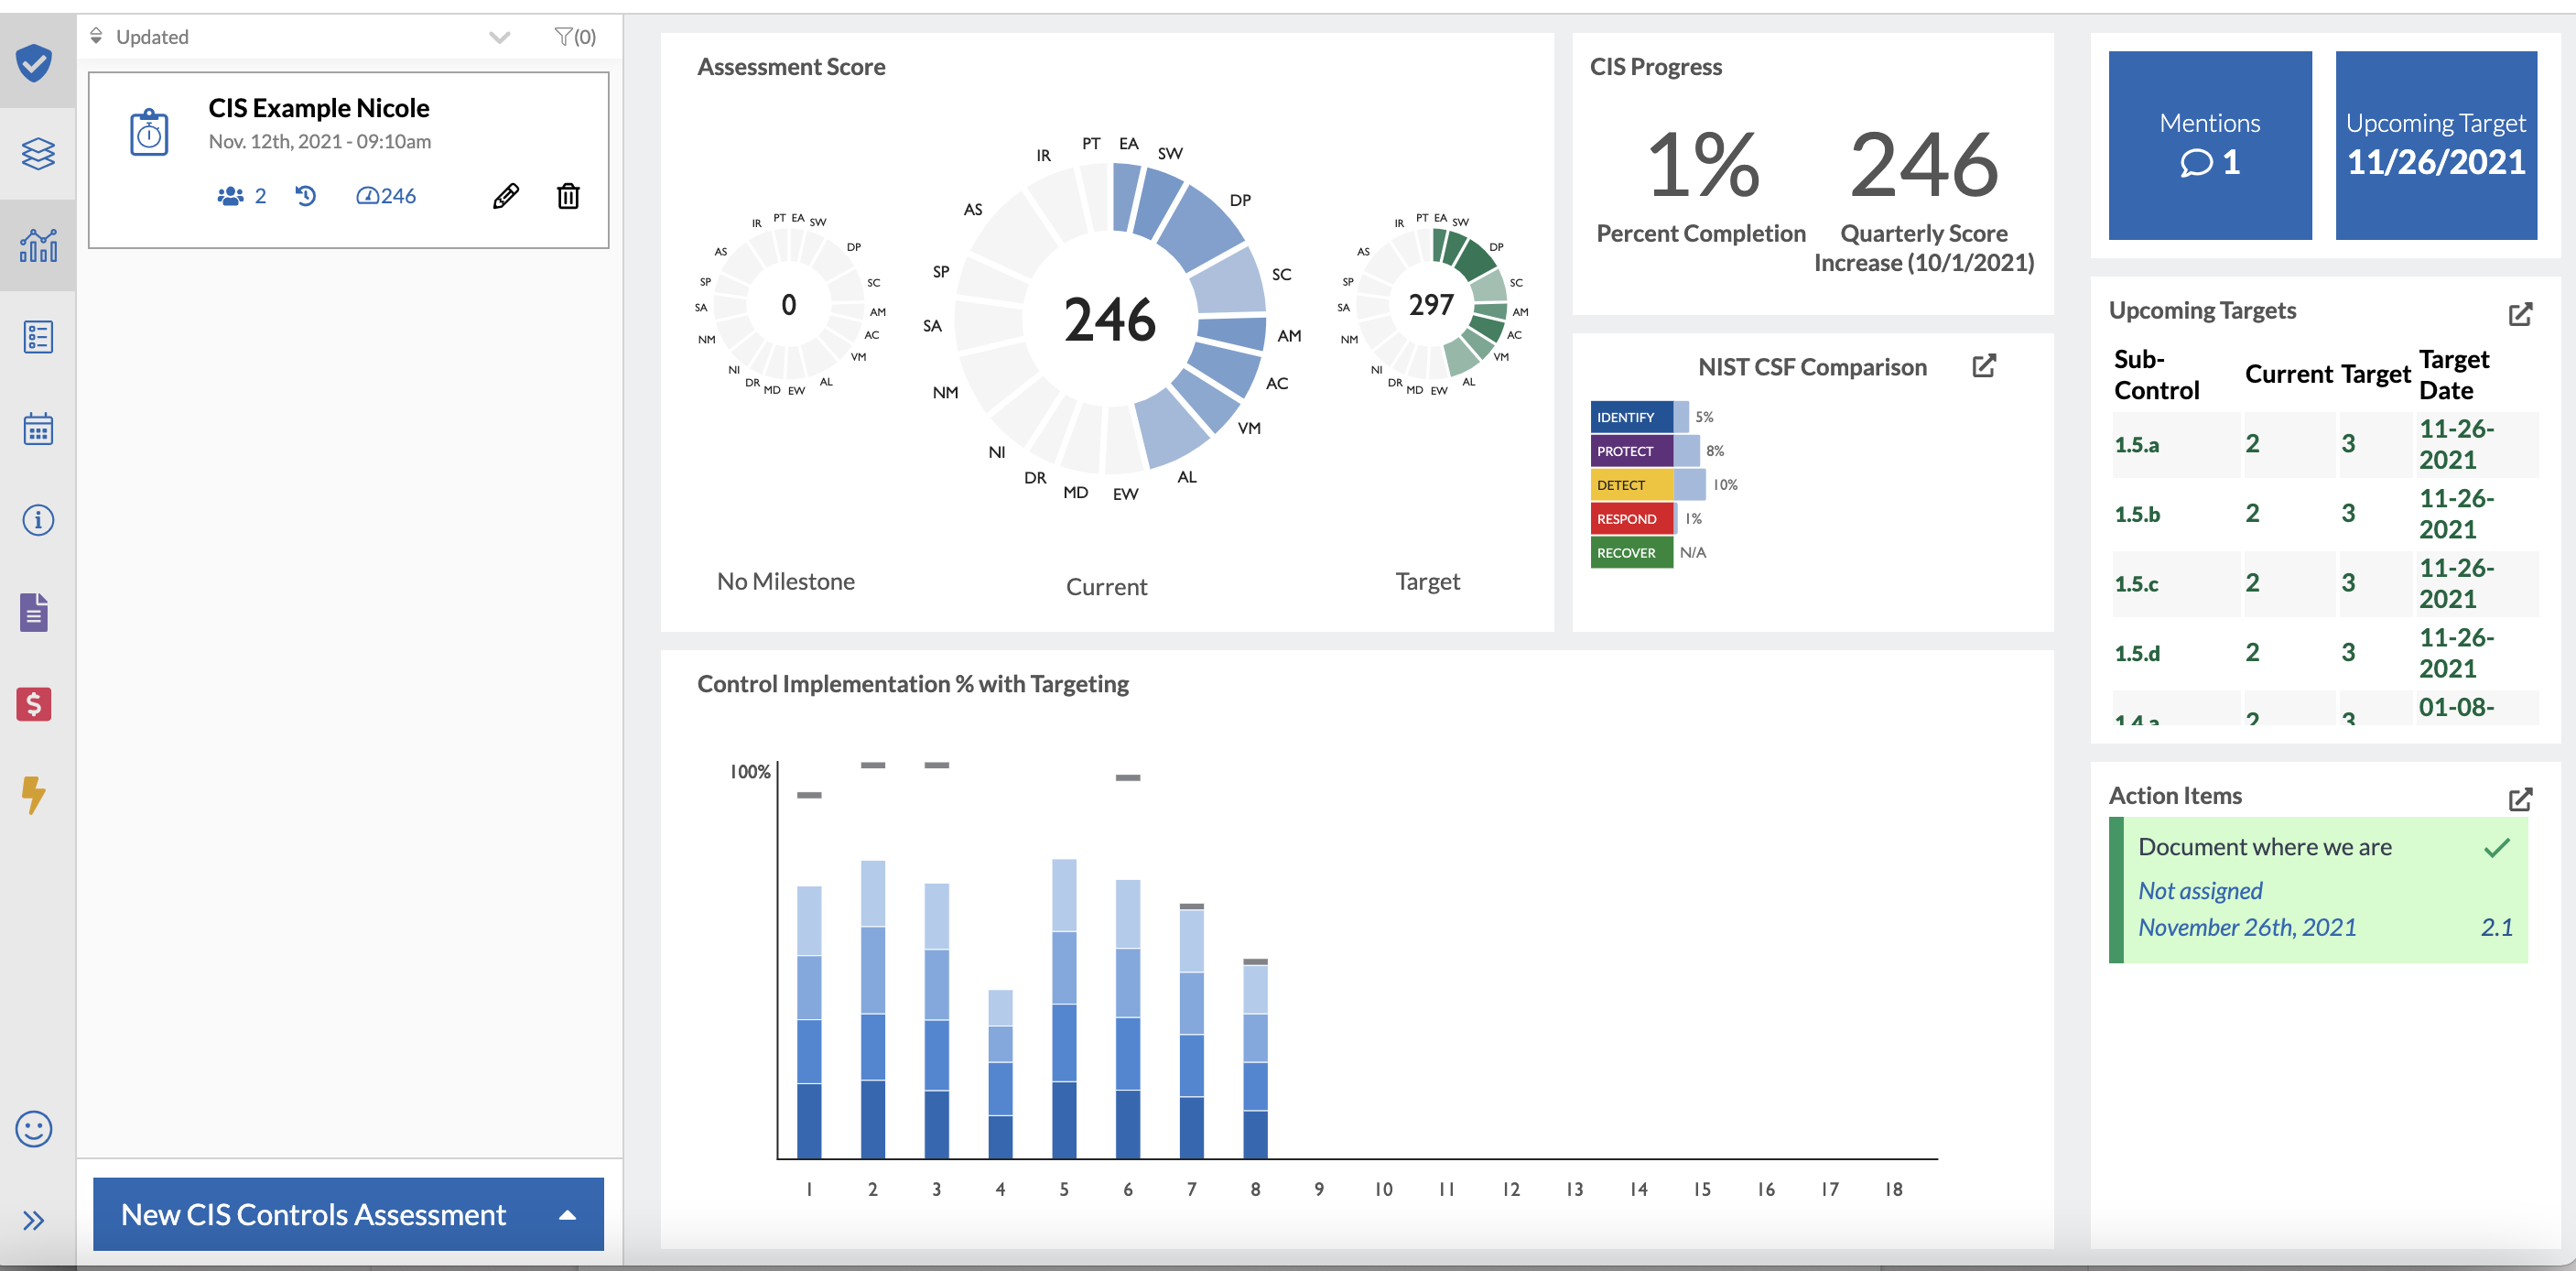
Many widgets in Axio360 provide details about the current state of ongoing or completed assessments, and many show score visualizations. Scoring an entire assessment can omit details; however, it makes it easy to talk about the current state of the assessment work and compare it to past and future states. Axio360 provides those values on a 1000 base to visualize the assessment scores. Scoring against 1000 allows Axio to visualize changes in data with the smallest impacts when performing assessments.
In the widgets and reports, Axio provides information on individual domains and categories of each model to distinguish one score being considered excellent for one control initiative, while the same score for another control initiative of the assessment might be terrible. Looking at an assessment as a whole, having that same score across the board might be a very good outcome.
Scores reflecting the overall state of an assessment, while visualized with larger integers, are better to benchmark. Security assessment models usually don’t have associated scores. Axio, however, came up with a formula to score those assessment responses to allow for benchmarking and comparisons of process states. Interim states on a single exercise are at times done via small numbers or percentages, which Axio then converts and combines into the 1000 scoring scale. Scores consider the credit received at various completion levels of the assessment process.
Like score representations with 0 through 4 number scales, the higher number indicates a greater maturity. With the 1000 scale, users can also see how far away the process is from reaching the next milestone, which can serve as a motivator.
Assuming the following scoring values:
| 0-4 scale | 1000 scale | state |
|---|---|---|
| 0 | 0 | not started |
| 1 | < 250 | Just started, but might be close to 1/4 maturity. |
| 2 | < 500 | Well into the process, but might be close to half-way maturity. |
| 3 | < 750 | More than half-way, but might be close to 3/4 maturity. |
| 4 | 1000 | A solid 4 or 1000 indicates full maturity of the assessment process, but if scored on a 0-4 scale, this might be seemingly unachievable if all the user sees is a 3, while on a 1000 score scale, seeing a 989, for example, will be an indicator that the goal is almost achieved. |

Completion indicators on the CIS model are by percentage.

Quantification widgets and reports are visualized in dollar values. Cyber risk exposure must be measured in monetary value only.